Do you think Automated trading is only for the big boys? Are you missing trades for various reasons? Ever wanted to autotrade your own strategy or quickly backtest a trade idea? Looking for something more versatile and simpler to use than Sierra Chart spreadsheets? Read on and get to know the new SST AutoTrader Study and give it a try with a free 21-day trial.
More...
V2 of the SST AT was just released (22 nov 2019). V2 has quite some improvements and extra functionality. V1 will be discontinued in January. I am working on a dedicated Autotrading page so everything is available from one place. Enjoy testing your trade ideas.
In this blogpost I will show you everything you need to know to get started with the new SST Autotrader Study for Sierra Chart. The SST Autotrader Study makes automated trading a reality for every Sierra Chart user.
After explaining some automated trading basics when using Sierra Chart and the main concept behind the SST Autotrader study, I will show you how you can generate your own BUY and SELL signals using built-in SC studies.
The SST Autotrader Study: #SOLID automated trading in Sierra Chart. Never miss a trade again!
The last part of this post will dive into the study settings and the first case study that will serve as an example to demonstrate the Autotrader Study settings and possibilities.
Highlights of the SST-AutoTrader configuration options
Automated trading in Sierra Chart made simple.
Use "freetrial" at checkout to make the trial 100% free!
1 - Safety First
Trading is risky and not suitable for all investors. Please read the Disclaimer and the Terms and Conditions of the SST website. As a trader you will always be responsible for your own trading including the settings of your platform, data provider, any studies and/or supporting software that you use. While the SST AutoTrader Study has a safe set of default settings and also has inherent checks to prevent misconfiguration you will need to familiarize yourself with this study as well as with using the Sierra Chart platform. This study is NOT for absolute beginners!
"The SST Autotrader Study is not for get-rich-quick seekers. Educate yourself instead of finding new ways to blow up your account. Yes, this involves spending time, having patience and do some hard work. Taking consistent action will transform you!"
For most of your Sierra Chart questions, the Sierra Chart Documentation and SC Supportboard are a great resource. Infinity Futures also has great videos on their YouTube Channel that can be helpful to get a better understanding of this amazing and versatile trading platform called Sierra Chart. With a bit of work you can quickly surpass the absolute beginner stage.
Sierra Chart automated trading primer
In the below video I will go through some Sierra Chart settings and configuration preparations that can be useful to consider prior to using the Autotrader Study.
Summary points on Safety
2 - The SST Automated Trading Concept
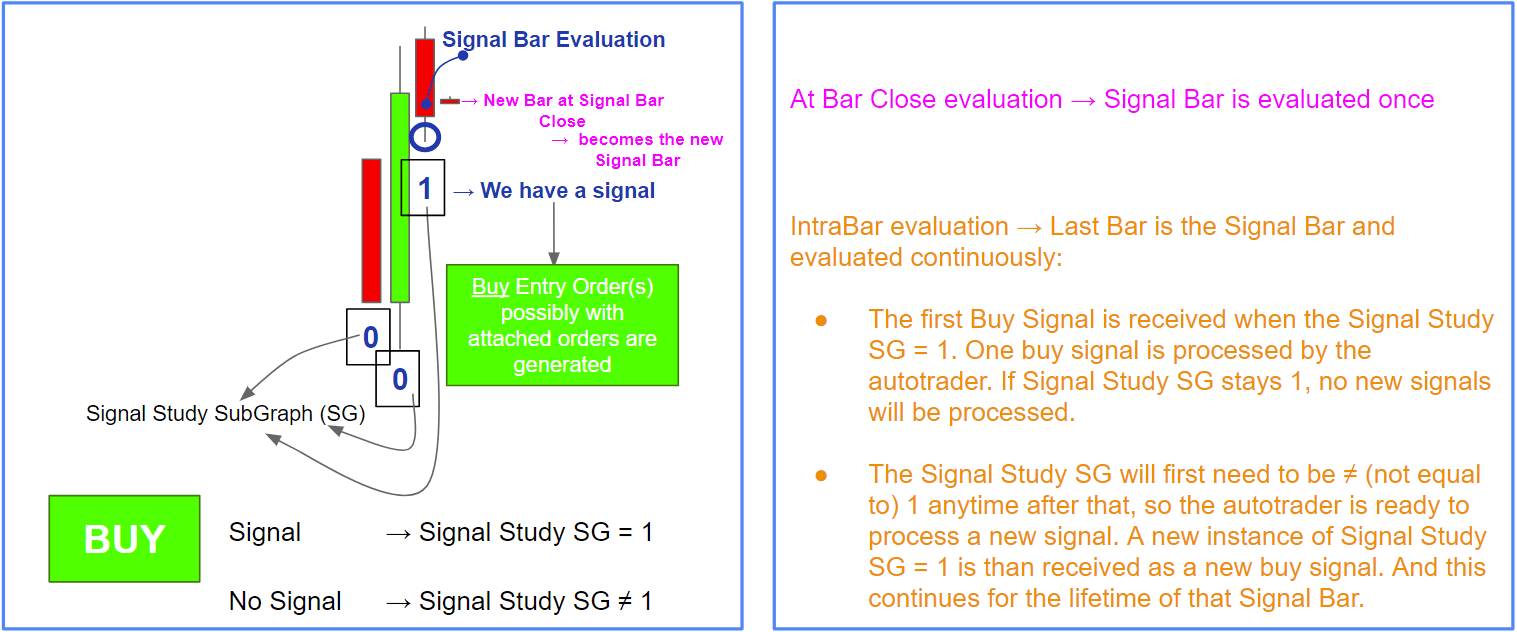
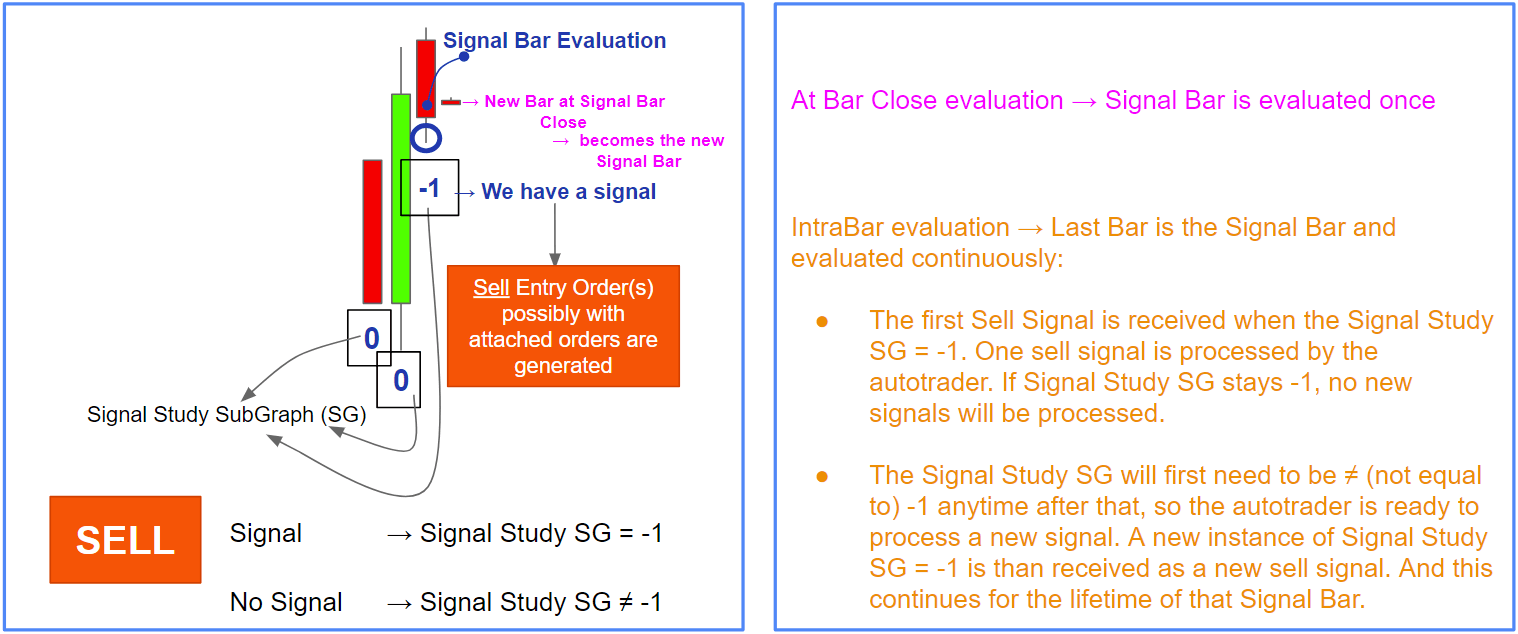
The main concept of this study is that signal generation and automated trading (entry, exit and management) are separated in different Sierra Chart studies. The SST Autotrader study will take care of the automated entries, trade management and exits in accordance with the settings. The most important and obligatory setting will be the Signal Study input, another study that generates appropriate BUY and SELL signals. The autotrader tracks the Signal Study Subgraph for conditions to generate entry orders. If the Signal Study Subgraph equals "1" on the current price bar, a buy signal is detected and if it equals "-1" a sell signal is detected.
Separating Signal generation and Automated Trading
Signal Study Input - Using another Sierra Chart Study that generates appropriate buy and sell signals. The SST Autotrader Study will track the Signal Study and process a "1" as BUY signal and "-1" as SELL signal.
This sounds a bit techy, but it is not that hard to understand. A Signal Study can be made by any Sierra Chart user with readily available and built-in Sierra Chart studies. The study called "Color Bar based on Alert Condition" is your true friend. I will show you how to do that with simple examples in the next part of this blogpost. If your signal generation rules are a bit more complicated, it also possible to get custom development work done to create your specific Signal Study. A stable Signal Study is vital for the use of the SST AutoTrader Study.


The Autotrader study has many options to facilitated most trading concepts, for example: long only, short only, auto bracket orders, auto-entry with SC brackets, manual entry with auto-management, auto-entry with manual management.
3 - Generate your own Signal Study
We now know we need to have a solid Signal Study in order to use the automated trading study. How can we create this study with existing and available SC studies? We start with the study called: "Color Bar based on Alert Condition" (CBBOAC) and combine the possibilities within Sierra Chart to use so called simple alert conditions. The alert conditions can be constructed with small steps of logic and be used to generate the buy and sell signals described in the previous section. Check out the documentation on simple alert conditions.
Generating a Signal Study SG = 1, the BUY signals, is relatively simple. In order to create a "-1" or SELL signal you will need to use a little but simple two-step trick. Check out the video below where I go through a MA crossover example.

* Note. Creating a -1 for the SELL signal is easier now as the CBBOAC study has a custom value option. See picture above.
Now we get a bit more technical
The video above explains a simple MA crossover example where ID1.SG1 represents the fast SMA and ID2.SG1 is a slow SMA. An example (there are other ways as well) of a possible BUY signal alert condition can be the following:
BUY Signal alert condition example
=CROSSFROMBELOW(ID1.SG1, ID2.SG1)
This basically means whenever the fast SMA crosses the slow SMA from below, the alert condition is true and generates a SG value of "1" for the Colorbar Subgraph of the CBBOAC study. This is the BUY signal. Quick and easy.
The same way we can generate a SELL signal condition to be the following:
SELL Signal alert condition example
=CROSSFROMBELOW(ID2.SG1, ID1.SG1)
There is a new version of the CBBOAC study since my first videos were released, which will make it a tad easier to create the -1 value. All you need to do is the following:
- * Set "Output When Condition True" to "Use Custom Value"
- * Set "Custom Value Output When True" to -1
See picture below.

How does it look?
Visual aspects are important. Using the CBBOC study has a visual aspect as well. Personally I set the drawstyle to ignore on both my long and short Signal Study and use a different study to create the visual aspect. In the example above, especially for the sell signal study, make sure you set the the Colorbar subgraph drawstyle to ignore so you prevent all your bars being colored. For a visual representation of the signal, the "Color background based on alert condition" study is my personal choice. As seen in the video this is easily set up.
Expand and grow
There you go, you have constructed your own Signal Study for BUY and SELL signals and I bet it wasn't that hard. From this very basic example you can expand your conditions to actually construct a real Signal study. You might want to check out the Infinity futures Youtube channel, where Patrick Z does a great job explaining this subject. Where Patrick's goal is to de-clutter the charts and condense only necessary information in a single visual representation, you can use the same concept to construct a more advanced Signal Study.
Along with the CBBOAC study, another Sierra Chart study called "Study/Price overlay" is a powerful ally when for example you wish to use other timeframe conditions in your Signal Study. This is something for a future case study on this blog.
Need a Customized Signal Study?
There might be conditions that can only be captured using custom programming. Hit me up via the contact form if you are looking for a #SOLID custom Sierra Chart Signal Study that works flawlessly with the SST Autotrader.
4 - Let's get busy
The SST Autotrader Study settings are documented inside the study and can be seen when you use Sierra Chart, click the "Display Study Documentation" button when loading a custom study or the "Description" button in the study settings to get the full details of each setting.
Included with the SST Autotrader Study is an additional study that allows you to use BUY and SELL buttons to manually create BUY and SELL signals and let the autotrader manage the signals and trades that follow. This study is also explained in the case study video below.
In the case study video I will go through most of the SST Autotrader Study settings and provide some more details. The best way to get to know the SST Autotrader Study is to start experimenting. Get busy and challenge yourself, the study can be used for a one-time 21-days free trial.
Case study #1 - Simple MA Cross-Over Strategy
Study precedence is important!
When adding the SST Autotrader Study to your study list, make sure the SST Autotrader Study is below the Signal Study. This needs to be done to make sure the signals are available to the Autotrader when they are created.
Get the FREE excel trade journal spreadsheet!
When you sign up for a trial of the SST Autotrader study I will also set you up with an awesome free excel spreadsheet that is specifically made for importing your Sierra Chart trades and have a useful overview of your trade statistics and results. The excel spreadsheet is available by clicking on the download button in the email that is send from gumroad.com after you complete the checkout process. Check out the last video below that explains the use of the sheet.
Automated trading in Sierra Chart made simple
Support
As said before, if you are an absolute beginner with Sierra Chart, get educated on using Sierra Chart for your use-case and take the time to read some documentation and try things out. Trading is not a click one button and be rich instantly kind of thing. At SST I do not sell a particular strategy, you will have to create your own and this takes time, patience and hard work. The SST Autotrader Study can help you with this.
As the creator of the SST Autotrader Study I am well aware that there are a substantial number of settings and that this can be overwhelming at first. The 21-day trial is however long enough to seriously test your own trading concept and decide if you want to purchase this study.
Consider this blog as the documentation of the Autotrader study that will likely improve over time. For additional custom development requests or an in depth consultation call please use the contact form and I will get back to you asap and set you up with a decent quote.
Now It's Your Turn!
- So that’s it for the first blog post on the new SST Autotrader Study.
I hope you enjoyed it. Now I’d like to hear your take on this:
- - What is your favorite feature?
- - What Signal Study are you generating?
- - What case study would you like to have covered in a next blog post?
- Or maybe you are missing a feature or you have a question about something from this post.
- Either way, let me know via twitter, by emailing me, filling in the contact form, or leaving a quick comment below.
Does this system takes into account volatility for stops and targets etc?
Is it possible to be programmed according to ATR or other
volatility study?
Hi George. Thanks for your question. The autotrader study is not a “system” but a ways to automate your entry, trade management and exits. You need a Signal Study that generates the BUY and SELL signals which the autotrader will use to create your orders and manage them.
Yes. When you use ATR or any other study that has a SubGraph (This SC language: https://www.sierrachart.com/index.php?page=doc/ChartStudies.html#SubgraphsTab), you can use this for your target and stop.
Are you a Sierra Chart user?
thanks for the clarification Frederik,
yes,
happy sierra chart user 2 years now.
hello Frederik……Thank you for this Blog post…..i am patiently waiting for the next one especially where you mention “Along with the CBBOAC study, another Sierra Chart study called “Study/Price overlay” is a powerful ally when for example you wish to use other timeframe conditions in your Signal Study. This is something for a future case study on this blog.”
Looking forward to more on this matter.
Thank you again.
Hi Bobby. Thanks for your comment. More show cases are coming. If you have a simple trade idea that you would like to have covered, let me know.
Thanks for the info.
Hi Frederik. I created my first buy and sell signal using the “Color Bar based on Alert Condition” (CBBOAC), however, when i change to get a -1 as a sell signal, it does not seem to work. Right now i generate +1 for a buy, and +1 for a sell. After that, i follow your steps (include !(..) and set “Use -1 on False” to “Yes”, but then i get all 1s except the sell signal that i get -1. Does it make sense? Any help would be much appreciated! thanks
Hi David,
Thanks for getting in touch. From what you describe you are getting exactly what you need for a sell signal. A sell signal produces a -1 on the signal bar. The SST AT study will ignore any other values and only is looking for a -1 to initiate a short trade. You should be good to go and assign this SG to the short signal input in the SST AT. You will need to use a second CBBOAC study to define your long signal. If you need more help, just write me an email and I will try to help you out.
Hi Frederik, it’s still not clear to me what SST Auto Trader does? Is it to make auto trading in Sierra Charts easier? Is it possible for you to create a simple example showing how to implement an auto trader with and without using SST AT?
Hi Peter. My study is meant to be more versatile and easier to use than built-in SC studies. For other AT options in SC you can check the SC documentation. There are plenty of simple examples with the SST AT in other blog posts.
I have a third-party signal generator that generates 1 for buy or 1 for sell. I only know from the output to this spreadsheet. Is there any fix or setting in your AT to work around this situation.
Also,
1. the documentation description does not come up when I click description button SC. I am running the 21-day trial.
2. Is there a button to toggle shorts and longs.
3. Where can I find documentation on the studies in the bundle
you can generate a -1 for sells by a simple multiplication using a spreadsheet formula study or a CBBOAC study.
1. that’s a SC issue, can’t help with that, maybe make sure you have a default browser set in windows.
2. there is a support study for toggling, there is also a right-click toggle option
3. clicking the study description button.
Hey Frederik,
Can I pass a contract/position size from a different study or is it fixed in the study?
Hi Zoref,
It’s a fixed setting. There is a support study in the AT bundle, that allows you to increase size with a set factor when scaling in.
I can work on an additional support study for more dynamic order sizing based on another study. It kind of depends on your use-case. Send e an email on what you are looking for and I will have a look.
Frederik
Thanks for replying. I didn’t realize there’s no notification for a reply.
I calculate my position size based on the ATR and I wrote a small study that takes care of it and display it to me on the screen. Currently I’m trading manually, and I was planning to test some ideas based on it, so I was wondering if I could feed the output of my study into your automation study.
I will see if I can add this to the bundle in next week or so.
Thank you very much!
This is now added. Restart Sc to get the latest bundle version. Check out the study documentation on how to use this support study.
Awesome, thank you very much!
Can I use attached orders for a trailing stop (i.e. move to break even after 4 ticks in profit and then trail)?
If I would use ASCIL for the signal study – what would be the draw style (normally one would use ARROW_UP ARROW_DOWN) but with the values of 1 or -1 the signals will not be displayed on the price graph..
Instead of assigning a value 1 or -1, one can create 2 subgraphs: one for buy and one for sell and then assign any real value on the graph (or close to it) so the signals are actually displayed where they belong. Then assign 0 for any other place with no signals. Detecting any (positive) value different than 0 would get the appropriate signals..
Yes. You have a lot of management options for a configured target and stop. There are options for move to BE and trailing. Alternatively you can use the SC trade window config by not using the stop and target in the SST AT and setting the GUI setting to yes. In that case you will only use the SST AT as you automated entry tool.
If you develop your own signal study for use with the SST AT, you will need to have an SG dedicated to the 1 long and -1 short signal, depending on the signal you can have a separate SG for the long and short. Any arrow or other draw style SG’s need to be filled with an actual price value to be displayed correctly, so these are separate SG’s and can not be used as a reference to the signal for the SST AT. It’s trivial to create an extra SG for this.